
From Data to Dialogue: What the NSS (National Student Survey) Reveals About UK Universities
- Dr Bidit Dey

- Mar 9
- 7 min read
Executive Summary
This article presents a thorough examination of the National Student Survey (NSS), exploring its development, structure, post-pandemic trends, and its influence on higher education policy throughout the UK. Conducted by the Office for Students (OfS) on behalf of the four home nations, the NSS collects perceptions of the educational experiences from final-year undergraduates. Since its inception in 2005, the survey has undergone significant revisions, notably in 2017 and again in 2023, when the overall satisfaction question was eliminated in England due to concerns surrounding subjectivity and its potential misuse in institutional rankings.
Utilizing data from the 2023–2025 cohorts, the article highlights increased response rates while also acknowledging a rise in disengagement, evidenced by more consistent answering patterns. Post-pandemic results reveal enduring disparities in student experiences across different subjects and home nations, with the theme of “student voice” consistently receiving lower scores compared to other areas. Analyses of equality and diversity indicate notable gaps: students with disabilities tend to score lower on most measures, while Black and Asian students report less favorable views on assessment fairness.
The article further details how national regulators—such as the Scottish Funding Council and Wales’s Medr—utilize NSS data to guide strategic planning and ensure quality assurance. In conclusion, it addresses criticisms, particularly regarding the survey's inappropriate use as a proxy for teaching quality, which may encourage a focus on short-term student satisfaction at the expense of educational rigor.
Introduction
The National Student Survey (NSS) is a comprehensive assessment conducted among final-year undergraduate students to gather their evaluations of various aspects of their university learning experience. This survey is administered and analyzed by the Office for Students (OfS), an independent regulator of higher education in England, established by the Higher Education and Research Act 2017 and operational since 2018. The OfS's core mission is to ensure that higher education serves students' interests. The NSS score of a university reflects the quality of teaching and the overall student experience at that institution, contributing to various rankings. As such, the NSS score is considered a key indicator of a university's performance, shaping its reputation and public perception within higher education.
Each spring, final-year undergraduate students from all universities and some colleges (who offer degree courses) in the UK are invited to participate in the NSS survey. The 2025 National Student Survey (NSS) consists of 28 questions organized into seven distinct themes. These themes encompass teaching quality, learning opportunities, marking and assessment, academic support, organization and management, learning resources, and the student voice. The survey thoroughly explores all key aspects of a student's academic experience within the university that shape their journey through the degree program and contribute to both personal and professional development. According to the Office for Students (OfS), thematic measures not only serve as indicators of institutional performance but also illuminate broader sector trends and characteristics, reflecting the overall national landscape. This data is utilized by the Ministry of Education's quality assurance authority to identify necessary policy interventions and adjustments within the existing policy framework.
This article explores data and trends from the latest National Student Surveys (NSS) and to assess how student experiences in UK higher education are evolving. Additionally, the article offers a critical perspective on the NSS, identifying and analyzing the inherent limitations of its measures.
Who administers NSS, and how it is designed and reviewed
As mentioned, the Office for Students (OfS) undertakes the NSS. Although OfS only regulates higher education in England, it administers the NSS on behalf of the other regulatory bodies of the home nations, such as the Higher Education Funding Council for Wales (HEFCW), the Scottish Funding Council (SFC) and the Department for the Economy, Northern Ireland (DfENI), who review and monitor the results in order to make necessary policy interventions. The survey itself is conducted by Ipsos, an independent research organisation. 357,000 students took part in the NSS in 2025, making it the largest annual surveys in the UK.
The NSS was launched first time in 2005. The structure, content, and methodologies of the survey have evolved significantly since then. Over the past decade, the NSS has undergone notable revisions. Following extensive consultations since 2015, a new NSS was introduced in 2017, incorporating nine new questions related to student engagement and modifying existing questions on assessment, feedback, and learning outcomes. Further reviews of the survey instruments took place in 2020. The pandemic's impact was reflected in subpar NSS results, with students nationwide expressing dissatisfaction with teaching and learning practices, access to accommodation, and other university services. Figure 1 illustrates a decline in NSS scores across all categories during the pandemic. Many observers at the time noted that students felt inadequately supported by their institutions. In the autumn of 2020, several universities unexpectedly closed their student accommodations due to the spread of the virus, leaving many students stranded. Additionally, the sector lacked substantial experience in remote learning and assessment, further negatively impacting students’ experiences, pastoral care, and overall performance.

In 2023, a new survey format was launched; however, the pandemic's residual effects were still keenly felt. The 2024 cohort was the first group of students to experience minimal pandemic-related disruptions. This year, the overall response rate rose to 72.3 per cent, up from 71.5 per cent last year. However, the proportion of students who completed the survey without engaging with it, indicating the same answer for every question, has increased from 3.2 per cent to 3.8 per cent. Students were also given the option to select “this does not apply to me.” For most questions, this response was under one per cent, but for the Students’ Union question (Q25), it reached 14.5 per cent. Due to structural changes, results from post-2023 cohorts cannot be easily compared to those from previous years. Now that we have three years of data since 2023 (2023, 2024, and 2025), we can analyze trends and make meaningful comparisons.
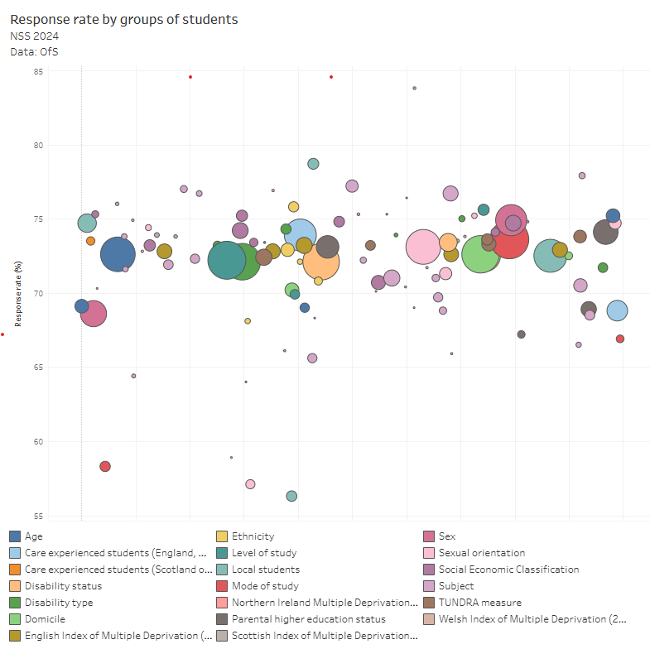
Figure 2 shows the NSS data of 2024, a typical representation of how the survey captures different demographic groups.
Post pandemic NSS
As mentioned, the Office for Students (OfS) has introduced a new structure for the NSS consisting of 28 questions, effective from 2023. Notably, the OfS has opted to eliminate the overall satisfaction question, commonly referred to as Question 27 or Question 28, depending on the version, from the survey for students in England. This decision was driven by several factors, including the observation that students often provide subjective opinions for this question. Additionally, there are concerns that framing students as consumers undermines the traditional teacher-learner relationship inherent in education. Critics also argue that media outlets and certain universities have misused the overall satisfaction question to manipulate rankings, which may detract from the survey's primary objectives.
Universities, however, often use complex metrics to demonstrate their total NSS results, as an alternative to the overall satisfaction question, which commentators do not find very convincing. It is more useful to analyse the sector data at a granular level. For instance, figure 3 shows how students in different home nations within the UK (England, Wales, Scotland, and Northern Ireland) feel about the challenges posed by their course.

Further analysis indicates that students pursuing food and beverage studies achieved the highest scores in the aforementioned category. Conversely, students in medical technology programs in Wales are the least positive about the fairness of their assessments, whereas maritime engineering students in England are the most dissatisfied with their Students’ Union's contributions. Although this specific thematic data may not be used for institutional rankings, it provides valuable insights for institutions and national policymakers. For example, the student voice historically receives lower scores compared to other categories, suggesting that either Students’ Unions and other platforms are not actively promoting students’ opinions, or students themselves are not sufficiently aware of the opportunities available to express and voice their concerns.
Policy measures undertaken due to NSS results
The Scottish Funding Council (SFC) clearly positions the NSS as a key tool for quality assurance among higher education institutions in Scotland. Northern Ireland fully participates in the NSS and uses it to guide regulatory oversight. The Department for the Economy (DfE) in Northern Ireland employs the NSS to monitor educational quality and ensure accountability within higher education. A notable example of NSS being integrated into policy formulation is the Welsh Government's recently developed Medr’s Strategic Plan 2025-2030. This framework leverages NSS scores to assess the quality of teaching, identify funding needs, evaluate the potential for future job creation, and consider the well-being of both staff and students. The Scottish Funding Council (SFC) clearly positions the NSS as a key tool for quality assurance among higher education institutions in Scotland.
NSS and equality and diversity
Research has shown that students with disabilities often have subpar experiences, highlighting the necessity for universities to reassess the facilities they offer. In the 2023-24 academic year, 19.9 percent of full-time undergraduates, 24.6 percent of part-time undergraduates, and 17.5 percent of undergraduate degree apprentices reported having at least one disability. As illustrated in Figure 4, students with disabilities tend to register scores lower than both the established benchmarks and their peers without disabilities.

There are variations in outcomes across ethnic groups, suggesting a potential association between ethnicity and lower NSS scores on certain themes. It has been observed that Black and Asian students report lower levels of satisfaction regarding the fairness of assessment and marking, suggesting they perceive discrimination in the evaluation process.

Figure 5 indicates that NSS scores for 2018 and 2019 among ethnic minority and mixed-race students reflect less positive perceptions of the fairness of marketing and assessment compared to their white counterparts.
Conclusion
The NSS has been a subject of controversy. In 2017, the National Union of Students (NUS), along with various local students’ unions at many universities, opted to boycott the NSS in protest against the decision to incorporate four elements of the survey into the nationwide Teaching Excellence Framework (TEF) exercise. TEF serves as a periodic assessment of the educational offerings of higher education institutions. Universities that perform well in the TEF are allowed to raise their tuition fees. A primary criticism of the NSS pertains to its widespread use. Institutions, media rankings, and policymakers often treat the NSS as a proxy for quality, despite the survey measuring perceptions rather than actual teaching quality. This practice creates distorted incentives, prompting universities to prioritize short-term student satisfaction over deep learning, rigorous academic standards, and meaningful educational development.


